Infarction ECG Interpretation
Introduction
A normal (physiologic) “Q” wave measures less than 0.04 second
Depth measures less than 1/3 height of R wave
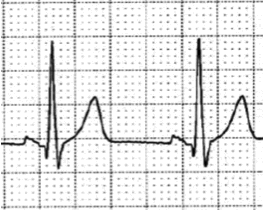
EKG
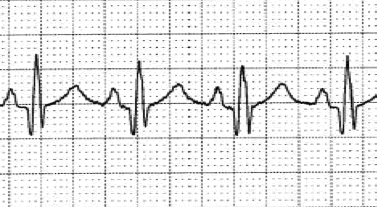
An abnormal (pathologic) “Q” wave measures 0.04 (small box) second or greater in duration, and/or the depth measures greater than or equal to 1/3 height of R wave
Once an MI is completed, the ST segment will return to the baseline and the T wave will return to its normal orientation, but “Q” waves are often the one remaining change to a cardiac complex as evidence that tissue necrosis or tissue death (infarction) has occurred.
Authors and Sources
Authors and Reviewers
- EKG heart rhythm modules: Thomas O'Brien.
- EKG monitor simulation developer: Steve Collmann
-
12 Lead Course: Dr. Michael Mazzini, MD.
- Spanish language EKG: Breena R. Taira, MD, MPH
- Medical review: Dr. Jonathan Keroes, MD
-
Heart sounds and mentorship: W. Proctor Harvey, MD
- Medical review: Dr. Pedro Azevedo, MD, Cardiology
-
Last Update: 1/8/2023
Sources
-
Electrocardiography for Healthcare Professionals, 5th Edition
Kathryn Booth and Thomas O'Brien
ISBN10: 1260064778, ISBN13: 9781260064773
McGraw Hill, 2019 -
Rapid Interpretation of EKG's, Sixth Edition
Dale Dublin
Cover Publishing Company -
12 Lead EKG for Nurses: Simple Steps to Interpret Rhythms, Arrhythmias, Blocks, Hypertrophy, Infarcts, & Cardiac Drugs
Aaron Reed
Create Space Independent Publishing -
Heart Sounds and Murmurs: A Practical Guide with Audio CD-ROM 3rd Edition
Elsevier-Health Sciences Division
Barbara A. Erickson, PhD, RN, CCRN - Clinical Heart Disease
W Proctor Harvey, MD
Clinical Heart Disease
Laennec Publishing; 1st edition (January 1, 2009) -
The Virtual Cardiac Patient: A Multimedia Guide to Heart Sounds, Murmurs, EKG
Jonathan Keroes, David Lieberman
Publisher: Lippincott Williams & Wilkin)
ISBN-10: 0781784425; ISBN-13: 978-0781784429 - Project Semilla, UCLA Emergency Medicine, EKG Training Breena R. Taira, MD, MPH