E is for Effusion
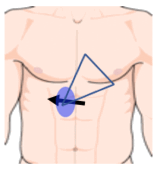
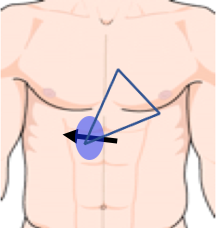
- Most sensitive view is subxiphoid
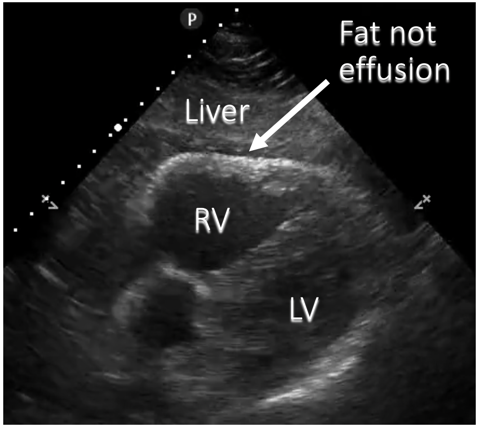
- Beware pericardial/epicardial fatty tissue
-
Can be graded as
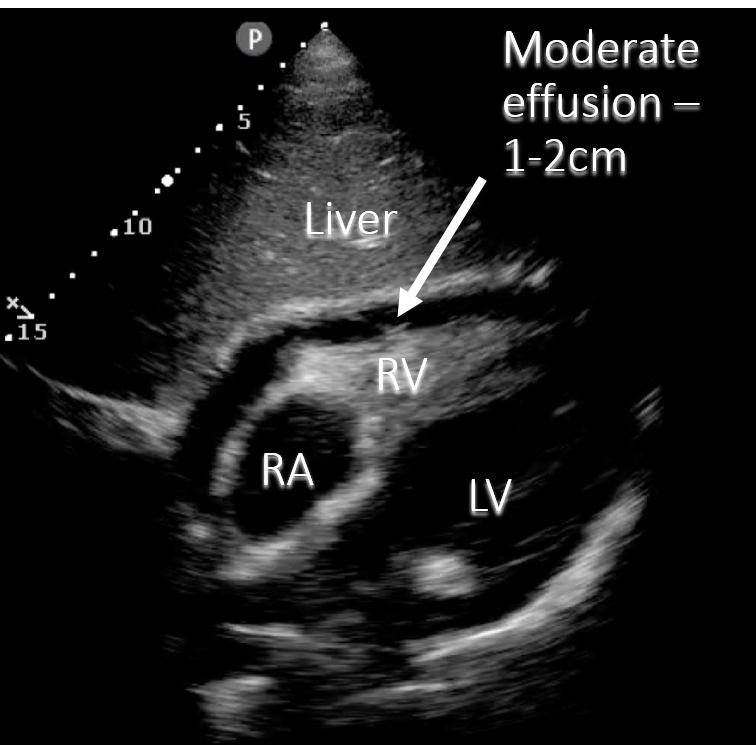
- Small (<1cm in diastole)
- Moderate (1-2cm)
- Large (>2cm)
-
Tamponade
- Clinical diagnosis: hypotension with effusion
- See 5Es advanced
Narration
So the first E we're going to talk about is E for effusion, and this is the most basic pathology we're looking for- it’s fluid around the heart. It should appear black, and this could be blood or could be just fluid from something like a viral pericarditis. The most sensitive view to pick up a pericardial effusion is typically the subxyphoid view. Effusions tend to go posteriorly and inferiorly. By using the liver as a window we are able to see the most inferior part of the pericardium. We can grade effusions as small which is typically less than 1 cm in diastole in max measurement, moderate 1-2 cm, and large which is greater than 2 cm. Tamponade is really a clinical diagnosis where you have cardiovascular collapse, hypotension, from pericardial effusion. There are some clues on echo that we'll talk about a little bit in this lecture, as well as the more advanced lecture on echo.
Narration
So this is that same image just diagrammed again using the liver as a window, and we see that black fluid surrounding the heart, it’s indenting the right atrium slightly although there is some right atrial systole as well, and again this is a pretty classic moderate effusion with circumferential on a subxyphoid view.
Beware fatty tissue
Narration
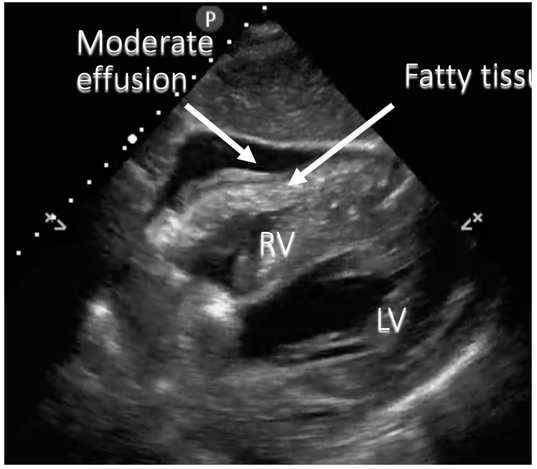
One thing to be careful of is over calling effusion when it’s something like this. Now this is a pretty extreme example, but this is actually fatty tissue around the heart. It looks a little bit dark, or hyperechoic, but if you look closely there are some echoes in there, and it’s not a crisp black area. Everyone has a little bit of lubricating fluid in the pericardium and one of the things I have my residents say over and over is "no significant pericardial effusion" so we don't want to over call this when its fatty tissue or not a real effusion.

Narration
So here's an example of a small but real effusion where we can also see the fatty tissue in there. This is a subxyphoid view again, with the fluid being seen next to the right ventricle and somewhat posteriorly along with some of the fatty tissue.
Apical four chamber (A4C)
Narration
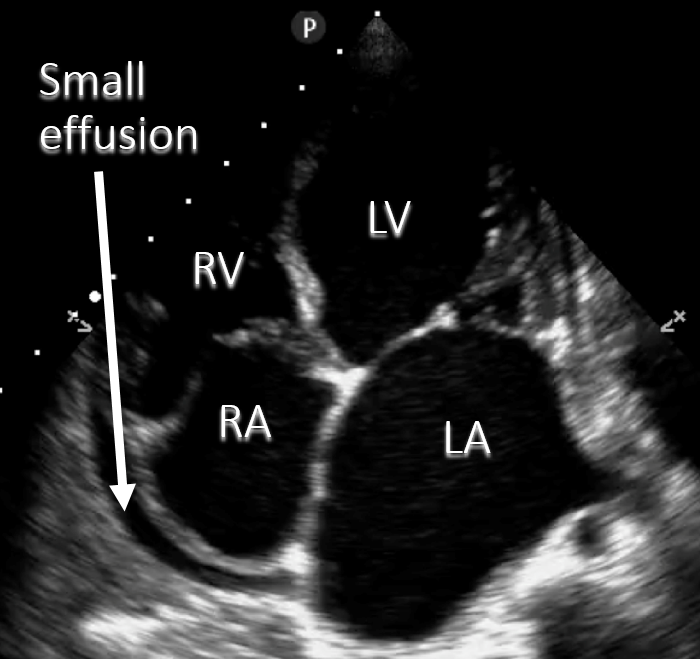
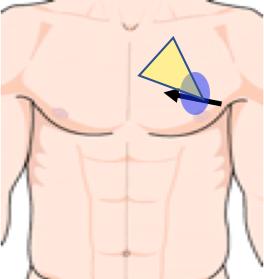
We can find effusions on different views; this is an example of an apical view looking up the heart from the point of maximal impulse. We can see a small but real effusion primarily behind the right atrium and right ventricle which is shown on this diagram here it’s not really impinging on the filling, but is consistent with a small effusion.
Parsternal long axis
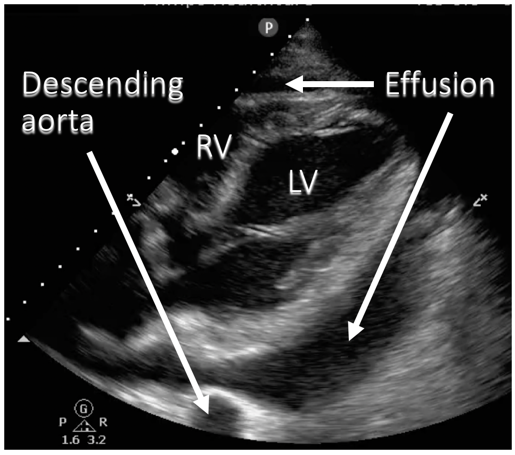
Look posteriorly
Narration
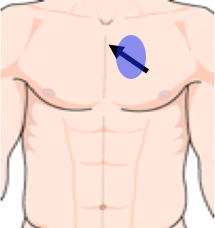
This is a parasternal long axis view showing a fairly large effusion, and the key on this view is that you do want to look at the inferior/posterior part of the pericardium where the effusion collects, rather than just the anterior part of the parasternal view. Here we see this large black area shown on the diagram as an effusion and you'll notice that it interposes itself between the posterior wall of the left ventricle and the descending aorta, which is seen as this circle sort of in cross section in the far field of the parasternal view. This is as opposed to a pleural effusion which may be lateral to the left ventricle, but does not interpose itself between the left ventricular free wall and the descending aorta.
- Apical four chamber (A4C)
- Large, circumferential
-
Heart swings to and fro
- Source of “electrical alternans” on ECG
Narration
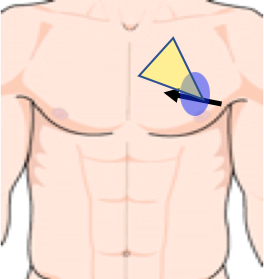
So here's another apical 4 chamber view with a large pericardial effusion. What you can see here is that the heart is moving somewhat to and fro, closer to and further away from the probe on the chest wall. If you were to do an ECG on this patient you might see phenomenon called "electrical alternans", where the QRS amplitude goes higher and lower and that is indicative of pericardial effusion or tamponade.
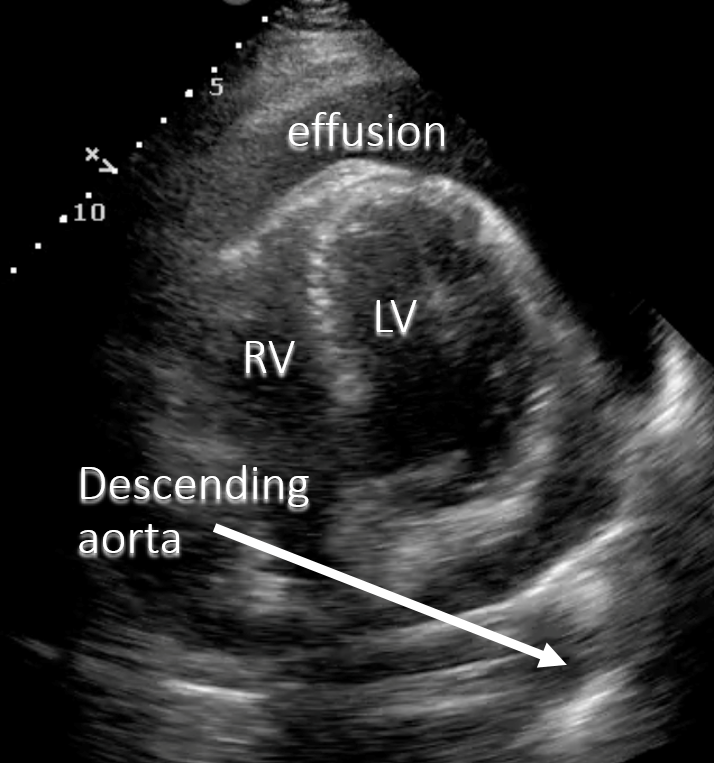
- Large (>2cm)
- Circumferential
Narration
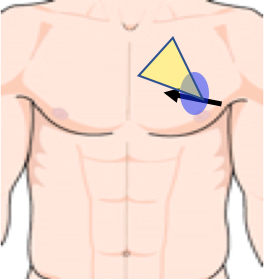
This is that same clip with the image diagrammed. That large circumferential pericardial effusion. You can also see the descending aorta, and again the effusion interposes itself between the free wall of the heart and the descending aorta.